_edited_edited.jpg)


Understanding Stock Analysis: Key Ratios and Patterns By: Stock Market Charlie
- Stock Market Charlie

- Nov 17, 2025
- 6 min read

Key Takeaways
Armed with the right intel, everyday investors can transform into market ninjas, using stock analysis to make decisions that might just outsmart the market itself.
When it comes to stock analysis, you have two trusty sidekicks: technical analysis and fundamental analysis. Pick your partner wisely!
Mastering the art of investing is like planning a heist: set your goals, dig deep into company secrets, and crack the code of financial market data.
Stock analysis might sound like something only the finance whizzes and MBA brainiacs can handle, but guess what? We're here to pop that bubble! With the right tools and info, stock analysis can be your new party trick. Ready to impress your friends and level up your financial game? Here’s the scoop to get you started.
What is stock analysis?
Stock analysis is the fancy term for evaluating an investment product (aka stocks, bonds, ETFs), an investment sector, or the whole market shebang. The beauty of stock analysis? It's like having a crystal ball to guess where prices might be headed, helping you make investment decisions that could beat the market. Just dive into past and present market data like a financial detective.
Types of stock analysis
There are two main flavors of stock analysis—technical and fundamental. Technical analysis is all about the stock price's dance moves, while fundamental analysis checks the company’s financial health like a doctor. Some investors mix both, using fundamental analysis to decide what to buy and technical analysis to figure out when to make their move.
Technical analysis
Technical analysis involves peeking at stock data generated from market shenanigans like volume (that's shares traded in a specific time) and price to spot trends and predict where prices might boogie next.
Generally speaking, technical analysis is built on these rock-solid beliefs:
Stock prices reflect all relevant information, meaning the market price is like a gossip column for all the news and factors affecting the company.
Stock prices follow trends, so once a trend is spotted, future prices tend to follow that trend like a lost puppy.
History repeats itself, especially in price movements, which technical analysts believe dance in recognizable, consistent patterns.
Here’s a sneak peek of technical analysis in action:
Imagine you’re eyeing ABCD stock and want to know if it's a good time to hop on or off. We’ll use a trusty technical indicator called moving averages to decide. Moving averages smooth out price data to reveal trends, as you’ll spot in the chart below:
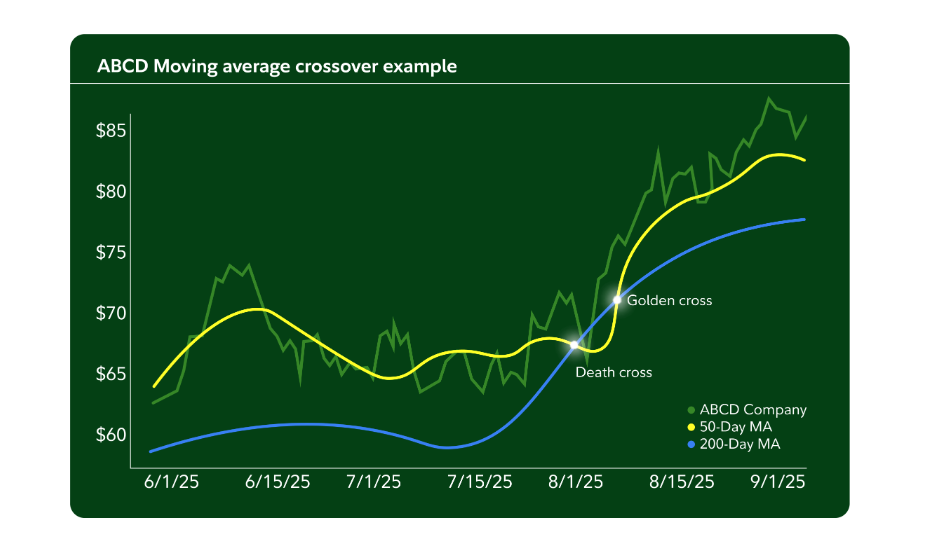
On August 1, the infamous “death cross” makes its grand entrance, where the 50-day moving average (MA) decides to limbo under the 200-day MA. This is the market’s way of saying, “Hey, maybe it’s time to sell!”
Fast forward a week, and the 50-day MA leaps over the 200-day MA, pulling off a “golden cross” maneuver, which basically waves a flag that says, “Buy, buy, buy!”
So, how do you do this technical analysis thing?
When investors dive into the world of technical analysis, they start with a stock’s price chart. Then they sprinkle on two types of indicators: overlays and oscillators.
An overlay is like a stylish hat you plop right on top of a price chart to jazz up your analysis of price moves and trends. Moving averages are the go-to hat, along with Bollinger Bands®, which are like the fashion police determining if prices are too high or low on the style meter.
Oscillators, which chill below the price chart, are like the stock market’s mood rings, helping analysts figure out if a stock is feeling oversold or overbought. Popular examples include the Relative Strength Index (RSI), which measures the speed and change of price movements, and the Stochastic Oscillator, showing where a stock’s closing price stands in its range over time.
A chunk of technical analysis is about figuring out the epic tug-of-war between supply and demand in an investment, known as support and resistance. A support level is like a safety net where demand is strong enough to keep a stock's price from doing a nosedive. Meanwhile, a resistance level is like a stubborn ceiling where supply is so hefty that the price just can’t break through.

Fundamental Analysis
As the name hints, fundamental analysis is all about checking out the nitty-gritty of a company's financial situation. Imagine you're snooping through a company's financial statements and public filings like a detective, trying to figure out if the stock is a pricey designer sweater or a steal from the clearance rack. An overvalued stock is like that sweater with a price tag that makes your wallet cry, while an undervalued stock is the same sweater but on a sweet discount at the shop next door.
Fundamental analysis is your trusty magnifying glass to find out the true worth of a company’s stock price, based on its latest earnings, past growth rates, the price-to-earnings ratio, debt, and other financial and accounting shenanigans. Unlike technical analysis, which is all about the stock’s price, fundamental analysis is like a nosy neighbor peeking over the fence to see what’s really going on.
How do you do fundamental analysis?
Let’s take a gander at ABCD stock in the manufacturing world. First up, you might want to check out the company’s earnings per share (EPS), which is basically how much moolah the company makes for each share of stock. You can usually find this info in an earnings report or with a quick online search, just like finding the latest gossip on your favorite celebrity.
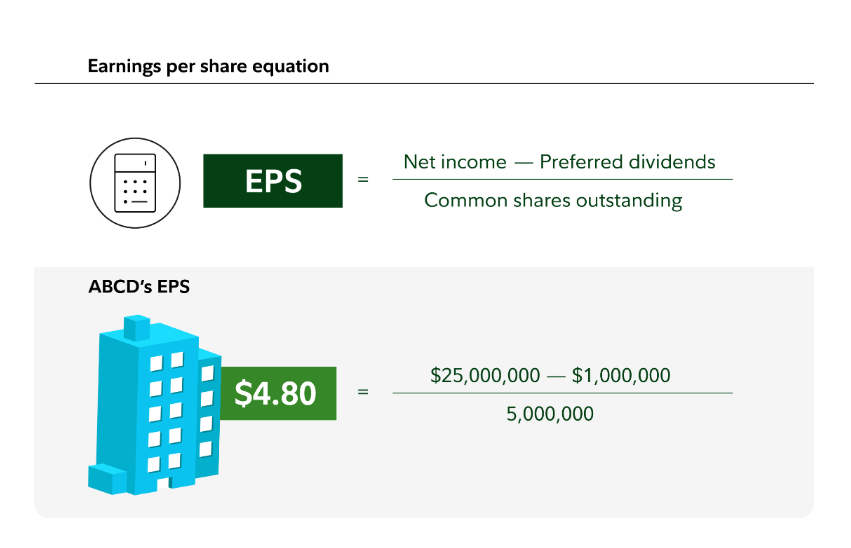
After giving ABCD's earnings report a good once-over, we discovered their EPS is strutting around at $4.80. To make sense of this number, check out past EPSs to see if it's been on the rise, which means the company is as healthy as a horse and rolling in dough. It’s also crucial to pit ABCD’s $4.80 EPS against other similar manufacturing companies to sniff out the industry average. A higher EPS generally means the company is raking in more cash for each share of common stock, and that’s always a reason to throw confetti.
But hold your horses, companies can play the sneaky game of buying back their own stock to shrink the number of outstanding shares, making their EPS look as shiny as a new penny without actually boosting net income. That’s why you need to peek at other ratios to get the full picture. Enter the price-to-earnings ratio, stage left.
ABCD’s price-to-earnings (P/E) ratio will spill the beans on how much investors are shelling out for each dollar of a company’s earnings. A high P/E would mean the stock's as pricey as a designer handbag, while a low P/E might scream bargain bin, and who doesn’t love a good deal?

A P/E of 15 is generally considered low, which could make this a good deal! But remember, you’d want to compare this number to ABCD's historical P/E and other P/Es in the manufacturing industry to get a better sense of the whole picture.
How to use stock analysis when investing
Both fundamental and technical analysis are like the gym workouts of the investing world—they need time, energy, and resources to pump up your decision-making muscles. You don’t need a finance degree to flex these tools, but you should know your way around them. Ready to jump into the stock market pool? Here's your splashy guide to stock analysis in your investing adventure:
Step 1: Define your investing goals and time horizon
Get clear on your why and when—this will inform the what and the how. Feeling a bit lost? No worries, this could help get you started.
Step 2: Pick a company or industry to research that aligns with your goals
Figure out how the company makes its dough, what the competitive landscape looks like, and who's steering the ship. This will help you decide if this is the right investment party for you.
Step 3: Perform your analysis
Start with the fundamentals when choosing a stock—dig into the company’s financial statements like you're looking for treasure. Check out trends in earnings, revenue, and debt. Calculate ratios (like EPS, P/E, etc.) to see if the stock is a bargain or a rip-off.
If you want to get all Sherlock Holmes about when to buy or sell, analyze charts to spot patterns or trends in the stock’s price history or trading volume. Use these clues to find potential entry or exit points.
Step 4: Consider external factors
Check out the overall stock market outlook and industry trends. Keep an eye on how things like inflation and interest rates might crash the party for the company and the market.
Step 5: Combine your findings
After you've gathered all your detective work and data, decide if the stock is the right fit for your investment wardrobe.
Once you’ve completed your analysis and you’re feeling like a stock market superhero, you may want to consider placing a trade.
Best Regards,
Stock Market Charlie


Comments